MSDN Articles on Managed Code Performance

These four articles on managed code performance in the .NET Framework provide useful and interesting reading. Two also provide an excellent code profiler utility that shows you exactly what's happening as your application runs, and describe in detail some of the things you want to consider when coding the application, as well as evaluating the performance overhead of many standard operations with some benchmark timings.
-
Performance Considerations for Run-Time Technologies in the .NET Framework
A good introductory article surveying the technologies at work in the managed world and a technical explanation of how they impact performance, covering the workings of garbage collection, JIT, remoting, ValueTypes and security.
-
Writing High-Performance Managed Applications : A Primer
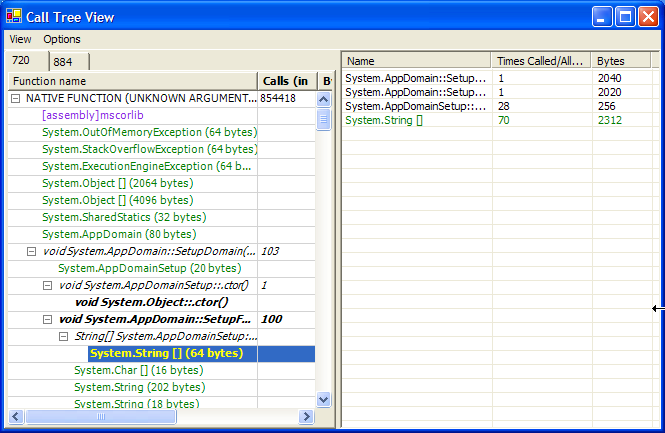
This is the article to go for. Lots of hints about how to maximise performance and the amazing code profiler which you can use to investigate what calls are being made, when garbage collection is occurring, how much memory you are using and much more. (It's almost a decompiler!)

Profiler Output Example - Call Tree View
-
Writing Faster Managed Code: Know What Things Cost
Read in combination with the primer. This article provides the same code profiler along with analysis and performance metrics for many typical operations, such as arithmetic, method calls, object creation, using properties, casts and instance type checks and so on. Constant reference back to the machine code generated by the Framework code may not help everyone but it does add legitimacy.
-
.NET
Performance Tips
A simple article describing performance tips for .NET code.